|
|
Home
|
|
|
Common Preprocessing Protocol |
|
|
Predictive Use
|
|
|
Explorative Use
|
|
|
Overlap Study
|
|
|
Downloads
|
-

Claudio Lottaz and Rainer Spang
Molecular Decomposition of Complex Clinical Phenotypes using Biologically Structured Analysis of Microarray DataCommon Preprocessing Protocol

This document describes the preprocessing protocol for background correction, normalization, summarization and quality assessment on microarray data applied on microarray studies used for illustration in this paper:

Methods
The steps performed to compute comparable gene expression values over an entire microarray study are background correction and normalization on probe level as well as probeset summarization:
- Background correction is computed similar to the MAS 5 software by Affymetrix. However, we do not avoid negative values for the cells and therefore changed the noise correction step. See the Affymetrix 'Statistical Algorithms Description Document' for details
- Probe level normalization is done using >the calibration and variance stabilization method. This method uses a asinh transformation (instead of the log) which renders the variance of probe intensities approximately independent of their expected expression levels. It can handle the negative values possibly resulting from the background correction. For each chip an offset and a scaling factor are estimated, assuming that a fair fraction cells are not differentially expressed across the study. Given the computational complexity of this method, parameters are estimated on a random subset of cells are then used to transform the entire arrays.
- Probeset summarization is performed using the median polish method on the arsinh normalized data. For each probe set a robust additive model is fitted acorss the arrays, possibly taking into account the different sensitivity of the probe cells via a probe effect.

Quality Assessment
The images and values described in this section are used to estimate the quality of a scan and hybridazation.
- Scan images and scaling factor: On raw images generated from
Affymetrix
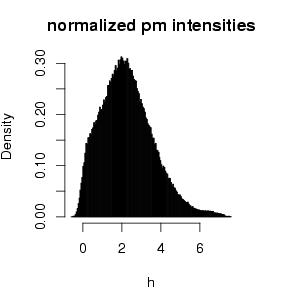
.DAT-files damaged regions of the chip, cristallizations and other artefacts are diagnosed optically. Scaling factors are expected close to one. - Histograms: Expression values are expected to be distributed roughly symmetrical. Large skewness in histograms as well as multiple modes are considered suspicious for hybridization problems. Histograms are generated on probes after normalization and on summarized probeset levels.
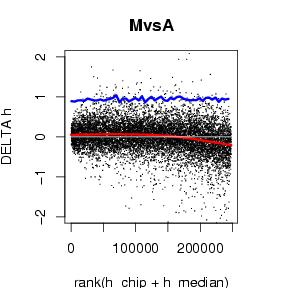
- MvA-plots: No dependency between expression level and average residuals to the median is expected. Therefor, an MvA-plot (ranks on the x-axis, residuals on the y-axis) should show constant width over all ranks. To ease the optical impression, an additional line showing 3 times running MAD is (median absolute deviation) drawn. MvA-plots are generated on normalized probes and summarized probeset.
- QQ-plots with standard residual error. We expect the distributions of gene expression values to be similar on all chips. A quantile-quantile plot of medians against a single chip should therefore be quite straight. The standard deviation error of such a plot measures how far away the actual plot is. QQ-plots are generated on normalized probes and summarized probesets.
- Box-Plots: A box plot over all chips on normalized probe levels and summarized probeset levels is expected to show similar distributions for all chips.


Software Used
The publically available software packages cited here are used together with our inhouse scripts and programs to implement an automated preprocessing pipeline.
- dat2png by Jochen Jäger reads an
DAT-file as it is created by Affymetrix scanners and converts it into a PNG image log transformed or percentile colouring. - BioConductor:
the packages
affyandvsnare used for reading, background correction, normalization and summarization. - preprocess is an R-package by Dennis Kostka containing a series of facilities for creating images and implements an MAS5 like background correction which allows for negative values.
- Various scripts by Jörn Tödling, Claudio Lottaz and Dennis Kostka for automating the pipeline.