|
|
Permutation Filtering

Stefanie Scheid
A major obstacle in the analysis of microarray data are hidden confounding variables like the genetic background of patients or undiscovered experimental artefacts, which leave traces in the expression data,
contaminating score distributions, and hindering a meaningful significance
analysis of differential gene expression. While the effects of know
confounders can be compensated using established methodology, so fare little
was known on how to deal with unknown confounders. We have developed a
computational method called permutation filtering, which exploits the
information across genes to detect and compensate the effects of hidden
confounders. Typically, significance analysis of microarrays is based on
permutation scores, which are derived from shuffling sample labels. If by
chance a single permutation correlates with a hidden confounder, the
resulting score distribution has larger tails. This can be detected by
transforming the random scores into p-values. By theory, these p-values
should be uniformly distributed. Any deviation from uniformity indicates
that a permutation resembles a hidden covariate thus introducing confounding
signal into the permutation test. In applications, we commonly observe
confounding permutations. A permutation might even introduce more signal
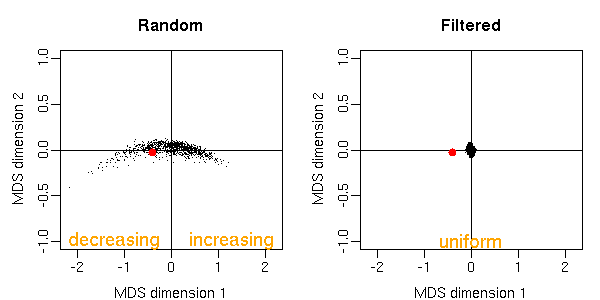
than the actual covariate of interest. In MDS representation in the figure
below, these permutations appear as outlying points. In Scheid and Spang
(2006) we propose permutation filtering to address this problem. The
underlying idea is that the p-value distributions across genes of random
class labels carry information, whether a candidate permutation is
correlated to an unknown confounding variable. If this is the case and there
exist a sufficiently large number of genes that are differentially expressed
with respect to the unknown confounder, a deviation from uniformity can be
detected. The rationale of permutation filtering is simply to avoid such
permutations. We could show that permutation filtering leads to a more
accurate screening for differentially expressed genes, and to more accurate
estimates of false discovery rates.
The method is implemented in our Bioconductor package twilight. Permutation filtering also improves the estimates of the Local False Discovery Rate.
|
|
Figure: Multi-dimensional scaling representation of 1000 random permutations and 1000 filtered permutations. Two points are close to each other if their p-value densities have similar curvature. Only points close to the origin have uniform p-value densities, others produce either increasing or decreasing densities. With filtering, only permutations with uniform p-value densities are left. The red dot denotes the observed labeling.
|
Publications
-
Scheid S and Spang R (2006):
Permutation filtering: A novel concept for significance analysis of large-scale genomic data
In: Apostolico A, Guerra C, Istrail S, Pevzner P, and Waterman M (Eds.): Research in Computational Molecular Biology: 10th Annual International Conference, Proceedings of RECOMB 2006, Venice, Italy, April 2-5, 2006.
Lecture Notes in Computer Science vol. 3909, Springer, Heidelberg, pp. 338-347.
ISSN: 0302-9743, ISBN: 3-540-33295-2.
[ pdf | doi:10.1007/11732990_29 ]
Software
 |
twilight - Estimating the local false discovery rate
An R/Bioconductor package for two-condition microarray experiments. Includes computation of scores, empirical p-values and local false discovery rates. For further information and download visit the software webpage of twilight. |
|